Tata Large Cap Fund -Regular Plan - Growth Option
| Category: Equity: Large Cap |
| Launch Date: 07-05-1998 |
| Asset Class: Equity |
| Benchmark: NIFTY 100 TRI |
| Expense Ratio: 1.99% As on (31-12-2025) |
| Status: Open Ended Schemes |
| Minimum Investment: 5000.0 |
| Minimum Topup: 1000.0 |
| Total Assets: 2,839.56 Cr As on (31-12-2025) |
| Turn over: 31.07% |
519.7643
13.4 (2.5775%)
15.29%
NIFTY 100 TRI -0.04%
PERFORMANCE of Tata Large Cap Fund -Regular Plan - Growth Option
Scheme Performance (%)
Data as on - 03-02-2026Yearly Performance (%)
Fund Managers
FM-1 Abhinav Sharma, FM-2 Hasmukh Vishariya
Investment Objective
To provide income distribution and / or medium to long term capital gains while at all times emphasising the importance of capital appreciation. However, there is no assurance or guarantee that the investment objective of the Scheme will be achieved. The scheme does not assure or guarantee any returns.
MONTHLY LUMPSUM RETURNS ( Invested amount 1,00,000)
| NAV Date | NAV | Units | Market Value |
Returns (%) |
|---|---|---|---|---|
| 07-05-1998 | 10.0 | 10000.0 | 100000 | 0.0 % |
| 08-06-1998 | 9.22 | 10000.0 | 92200 | -7.8 % |
| 08-07-1998 | 9.9 | 10000.0 | 99000 | -1.0 % |
| 07-08-1998 | 10.19 | 10000.0 | 101900 | 1.9 % |
| 07-09-1998 | 9.97 | 10000.0 | 99700 | -0.3 % |
| 07-10-1998 | 10.09 | 10000.0 | 100900 | 0.9 % |
| 09-11-1998 | 9.93 | 10000.0 | 99300 | -0.7 % |
| 07-12-1998 | 9.91 | 10000.0 | 99100 | -0.9 % |
| 07-01-1999 | 11.24 | 10000.0 | 112400 | 12.4 % |
| 08-02-1999 | 11.8 | 10000.0 | 118000 | 18.0 % |
| 08-03-1999 | 14.33 | 10000.0 | 143300 | 43.3 % |
| 07-04-1999 | 14.39 | 10000.0 | 143900 | 43.9 % |
| 07-05-1999 | 14.2 | 10000.0 | 142000 | 42.0 % |
| 07-06-1999 | 14.36 | 10000.0 | 143600 | 43.6 % |
| 07-07-1999 | 13.97 | 10000.0 | 139700 | 39.7 % |
| 09-08-1999 | 15.77 | 10000.0 | 157700 | 57.7 % |
| 07-09-1999 | 16.34 | 10000.0 | 163400 | 63.4 % |
| 07-10-1999 | 18.93 | 10000.0 | 189300 | 89.3 % |
| 11-11-1999 | 17.63 | 10000.0 | 176300 | 76.3 % |
| 07-12-1999 | 22.28 | 10000.0 | 222800 | 122.8 % |
| 07-01-2000 | 14.96 | 10000.0 | 149600 | 49.6 % |
| 07-02-2000 | 17.0671 | 10000.0 | 170671 | 70.67 % |
| 07-03-2000 | 20.8839 | 10000.0 | 208839 | 108.84 % |
| 07-04-2000 | 15.7788 | 10000.0 | 157788 | 57.79 % |
| 08-05-2000 | 13.9032 | 10000.0 | 139032 | 39.03 % |
| 07-06-2000 | 14.5122 | 10000.0 | 145122 | 45.12 % |
| 07-07-2000 | 15.0798 | 10000.0 | 150798 | 50.8 % |
| 07-08-2000 | 12.1959 | 10000.0 | 121959 | 21.96 % |
| 07-09-2000 | 14.3105 | 10000.0 | 143105 | 43.1 % |
| 09-10-2000 | 12.336 | 10000.0 | 123360 | 23.36 % |
| 07-11-2000 | 12.5634 | 10000.0 | 125634 | 25.63 % |
| 07-12-2000 | 12.8927 | 10000.0 | 128927 | 28.93 % |
| 08-01-2001 | 12.0734 | 10000.0 | 120734 | 20.73 % |
| 07-02-2001 | 12.5374 | 10000.0 | 125374 | 25.37 % |
| 07-03-2001 | 11.3345 | 10000.0 | 113345 | 13.35 % |
| 09-04-2001 | 9.8857 | 10000.0 | 98857 | -1.14 % |
| 07-05-2001 | 10.5083 | 10000.0 | 105083 | 5.08 % |
| 07-06-2001 | 10.4501 | 10000.0 | 104501 | 4.5 % |
| 09-07-2001 | 9.701 | 10000.0 | 97010 | -2.99 % |
| 07-08-2001 | 9.6937 | 10000.0 | 96937 | -3.06 % |
| 07-09-2001 | 9.1156 | 10000.0 | 91156 | -8.84 % |
| 08-10-2001 | 7.9626 | 10000.0 | 79626 | -20.37 % |
| 07-11-2001 | 8.918 | 10000.0 | 89180 | -10.82 % |
| 07-12-2001 | 9.5204 | 10000.0 | 95204 | -4.8 % |
| 07-01-2002 | 9.4712 | 10000.0 | 94712 | -5.29 % |
| 07-02-2002 | 9.8015 | 10000.0 | 98015 | -1.98 % |
| 07-03-2002 | 10.4278 | 10000.0 | 104278 | 4.28 % |
| 08-04-2002 | 10.3039 | 10000.0 | 103039 | 3.04 % |
| 07-05-2002 | 10.411 | 10000.0 | 104110 | 4.11 % |
| 07-06-2002 | 9.7263 | 10000.0 | 97263 | -2.74 % |
| 08-07-2002 | 10.5351 | 10000.0 | 105351 | 5.35 % |
| 07-08-2002 | 9.43 | 10000.0 | 94300 | -5.7 % |
| 09-09-2002 | 8.9191 | 10000.0 | 89191 | -10.81 % |
| 07-10-2002 | 8.7702 | 10000.0 | 87702 | -12.3 % |
| 07-11-2002 | 8.676 | 10000.0 | 86760 | -13.24 % |
| 09-12-2002 | 9.3271 | 10000.0 | 93271 | -6.73 % |
| 07-01-2003 | 9.6108 | 10000.0 | 96108 | -3.89 % |
| 07-02-2003 | 9.449 | 10000.0 | 94490 | -5.51 % |
| 07-03-2003 | 9.0883 | 10000.0 | 90883 | -9.12 % |
| 07-04-2003 | 9.4377 | 10000.0 | 94377 | -5.62 % |
| 07-05-2003 | 9.3925 | 10000.0 | 93925 | -6.08 % |
| 09-06-2003 | 10.711 | 10000.0 | 107110 | 7.11 % |
| 07-07-2003 | 12.7618 | 10000.0 | 127618 | 27.62 % |
| 07-08-2003 | 13.4605 | 10000.0 | 134605 | 34.61 % |
| 08-09-2003 | 16.2366 | 10000.0 | 162366 | 62.37 % |
| 07-10-2003 | 16.9747 | 10000.0 | 169747 | 69.75 % |
| 07-11-2003 | 19.0367 | 10000.0 | 190367 | 90.37 % |
| 08-12-2003 | 20.6928 | 10000.0 | 206928 | 106.93 % |
| 07-01-2004 | 23.2325 | 10000.0 | 232325 | 132.33 % |
| 09-02-2004 | 23.1388 | 10000.0 | 231388 | 131.39 % |
| 08-03-2004 | 24.6776 | 10000.0 | 246776 | 146.78 % |
| 07-04-2004 | 23.9578 | 10000.0 | 239578 | 139.58 % |
| 07-05-2004 | 24.3583 | 10000.0 | 243583 | 143.58 % |
| 07-06-2004 | 20.7225 | 10000.0 | 207225 | 107.22 % |
| 07-07-2004 | 20.8182 | 10000.0 | 208182 | 108.18 % |
| 09-08-2004 | 22.4133 | 10000.0 | 224133 | 124.13 % |
| 07-09-2004 | 23.3487 | 10000.0 | 233487 | 133.49 % |
| 07-10-2004 | 25.7426 | 10000.0 | 257426 | 157.43 % |
| 08-11-2004 | 25.8806 | 10000.0 | 258806 | 158.81 % |
| 07-12-2004 | 28.177 | 10000.0 | 281770 | 181.77 % |
| 07-01-2005 | 29.1646 | 10000.0 | 291646 | 191.65 % |
| 07-02-2005 | 30.4682 | 10000.0 | 304682 | 204.68 % |
| 07-03-2005 | 31.9666 | 10000.0 | 319666 | 219.67 % |
| 07-04-2005 | 31.0634 | 10000.0 | 310634 | 210.63 % |
| 09-05-2005 | 31.1539 | 10000.0 | 311539 | 211.54 % |
| 07-06-2005 | 32.5863 | 10000.0 | 325863 | 225.86 % |
| 07-07-2005 | 33.4584 | 10000.0 | 334584 | 234.58 % |
| 08-08-2005 | 35.8634 | 10000.0 | 358634 | 258.63 % |
| 08-09-2005 | 38.6196 | 10000.0 | 386196 | 286.2 % |
| 07-10-2005 | 39.8209 | 10000.0 | 398209 | 298.21 % |
| 07-11-2005 | 38.1101 | 10000.0 | 381101 | 281.1 % |
| 07-12-2005 | 41.8848 | 10000.0 | 418848 | 318.85 % |
| 09-01-2006 | 44.7438 | 10000.0 | 447438 | 347.44 % |
| 07-02-2006 | 48.139 | 10000.0 | 481390 | 381.39 % |
| 07-03-2006 | 52.5784 | 10000.0 | 525784 | 425.78 % |
| 07-04-2006 | 57.3814 | 10000.0 | 573814 | 473.81 % |
| 08-05-2006 | 60.4949 | 10000.0 | 604949 | 504.95 % |
| 07-06-2006 | 44.8704 | 10000.0 | 448704 | 348.7 % |
| 07-07-2006 | 48.4967 | 10000.0 | 484967 | 384.97 % |
| 07-08-2006 | 48.7781 | 10000.0 | 487781 | 387.78 % |
| 07-09-2006 | 53.4818 | 10000.0 | 534818 | 434.82 % |
| 09-10-2006 | 55.4081 | 10000.0 | 554081 | 454.08 % |
| 07-11-2006 | 58.6249 | 10000.0 | 586249 | 486.25 % |
| 07-12-2006 | 62.1585 | 10000.0 | 621585 | 521.58 % |
| 08-01-2007 | 60.9054 | 10000.0 | 609054 | 509.05 % |
| 07-02-2007 | 64.9442 | 10000.0 | 649442 | 549.44 % |
| 07-03-2007 | 55.8892 | 10000.0 | 558892 | 458.89 % |
| 09-04-2007 | 59.1819 | 10000.0 | 591819 | 491.82 % |
| 07-05-2007 | 62.6989 | 10000.0 | 626989 | 526.99 % |
| 07-06-2007 | 65.2921 | 10000.0 | 652921 | 552.92 % |
| 09-07-2007 | 70.6602 | 10000.0 | 706602 | 606.6 % |
| 07-08-2007 | 70.126 | 10000.0 | 701260 | 601.26 % |
| 07-09-2007 | 72.194 | 10000.0 | 721940 | 621.94 % |
| 08-10-2007 | 79.762 | 10000.0 | 797620 | 697.62 % |
| 07-11-2007 | 91.7205 | 10000.0 | 917205 | 817.21 % |
| 07-12-2007 | 95.8988 | 10000.0 | 958988 | 858.99 % |
| 07-01-2008 | 102.5939 | 10000.0 | 1025939 | 925.94 % |
| 07-02-2008 | 83.8533 | 10000.0 | 838533 | 738.53 % |
| 07-03-2008 | 75.6748 | 10000.0 | 756748 | 656.75 % |
| 07-04-2008 | 72.3376 | 10000.0 | 723376 | 623.38 % |
| 07-05-2008 | 79.3637 | 10000.0 | 793637 | 693.64 % |
| 09-06-2008 | 72.0215 | 10000.0 | 720215 | 620.21 % |
| 07-07-2008 | 64.8201 | 10000.0 | 648201 | 548.2 % |
| 07-08-2008 | 70.1627 | 10000.0 | 701627 | 601.63 % |
| 08-09-2008 | 69.7725 | 10000.0 | 697725 | 597.73 % |
| 07-10-2008 | 55.8625 | 10000.0 | 558625 | 458.62 % |
| 07-11-2008 | 49.604 | 10000.0 | 496040 | 396.04 % |
| 08-12-2008 | 47.4253 | 10000.0 | 474253 | 374.25 % |
| 07-01-2009 | 49.8922 | 10000.0 | 498922 | 398.92 % |
| 09-02-2009 | 48.6128 | 10000.0 | 486128 | 386.13 % |
| 09-03-2009 | 43.8617 | 10000.0 | 438617 | 338.62 % |
| 08-04-2009 | 52.1962 | 10000.0 | 521962 | 421.96 % |
| 07-05-2009 | 56.6158 | 10000.0 | 566158 | 466.16 % |
| 08-06-2009 | 70.9283 | 10000.0 | 709283 | 609.28 % |
| 07-07-2009 | 69.1983 | 10000.0 | 691983 | 591.98 % |
| 07-08-2009 | 74.1869 | 10000.0 | 741869 | 641.87 % |
| 07-09-2009 | 78.9575 | 10000.0 | 789575 | 689.57 % |
| 07-10-2009 | 82.7976 | 10000.0 | 827976 | 727.98 % |
| 09-11-2009 | 85.1583 | 10000.0 | 851583 | 751.58 % |
| 07-12-2009 | 87.9629 | 10000.0 | 879629 | 779.63 % |
| 07-01-2010 | 91.556 | 10000.0 | 915560 | 815.56 % |
| 08-02-2010 | 85.4788 | 10000.0 | 854788 | 754.79 % |
| 08-03-2010 | 90.3723 | 10000.0 | 903723 | 803.72 % |
| 07-04-2010 | 92.9828 | 10000.0 | 929828 | 829.83 % |
| 07-05-2010 | 88.6024 | 10000.0 | 886024 | 786.02 % |
| 07-06-2010 | 89.6674 | 10000.0 | 896674 | 796.67 % |
| 07-07-2010 | 94.8071 | 10000.0 | 948071 | 848.07 % |
| 09-08-2010 | 100.3315 | 10000.0 | 1003315 | 903.31 % |
| 07-09-2010 | 103.8518 | 10000.0 | 1038518 | 938.52 % |
| 07-10-2010 | 110.3413 | 10000.0 | 1103413 | 1003.41 % |
| 08-11-2010 | 111.7518 | 10000.0 | 1117518 | 1017.52 % |
| 07-12-2010 | 106.052 | 10000.0 | 1060520 | 960.52 % |
| 07-01-2011 | 102.2055 | 10000.0 | 1022055 | 922.05 % |
| 07-02-2011 | 93.0493 | 10000.0 | 930493 | 830.49 % |
| 07-03-2011 | 91.9294 | 10000.0 | 919294 | 819.29 % |
| 07-04-2011 | 98.2345 | 10000.0 | 982345 | 882.34 % |
| 09-05-2011 | 95.4552 | 10000.0 | 954552 | 854.55 % |
| 07-06-2011 | 95.8251 | 10000.0 | 958251 | 858.25 % |
| 07-07-2011 | 98.7235 | 10000.0 | 987235 | 887.24 % |
| 08-08-2011 | 91.5879 | 10000.0 | 915879 | 815.88 % |
| 07-09-2011 | 91.5195 | 10000.0 | 915195 | 815.19 % |
| 07-10-2011 | 88.1941 | 10000.0 | 881941 | 781.94 % |
| 08-11-2011 | 93.7582 | 10000.0 | 937582 | 837.58 % |
| 07-12-2011 | 89.5783 | 10000.0 | 895783 | 795.78 % |
| 09-01-2012 | 85.4087 | 10000.0 | 854087 | 754.09 % |
| 07-02-2012 | 93.3868 | 10000.0 | 933868 | 833.87 % |
| 07-03-2012 | 93.7863 | 10000.0 | 937863 | 837.86 % |
| 09-04-2012 | 94.9812 | 10000.0 | 949812 | 849.81 % |
| 07-05-2012 | 92.8188 | 10000.0 | 928188 | 828.19 % |
| 07-06-2012 | 92.389 | 10000.0 | 923890 | 823.89 % |
| 09-07-2012 | 96.4991 | 10000.0 | 964991 | 864.99 % |
| 07-08-2012 | 98.7227 | 10000.0 | 987227 | 887.23 % |
| 07-09-2012 | 100.0546 | 10000.0 | 1000546 | 900.55 % |
| 08-10-2012 | 104.1078 | 10000.0 | 1041078 | 941.08 % |
| 07-11-2012 | 105.4367 | 10000.0 | 1054367 | 954.37 % |
| 07-12-2012 | 108.2132 | 10000.0 | 1082132 | 982.13 % |
| 07-01-2013 | 109.1378 | 10000.0 | 1091378 | 991.38 % |
| 07-02-2013 | 107.8547 | 10000.0 | 1078547 | 978.55 % |
| 07-03-2013 | 106.5692 | 10000.0 | 1065692 | 965.69 % |
| 08-04-2013 | 100.6291 | 10000.0 | 1006291 | 906.29 % |
| 07-05-2013 | 108.2807 | 10000.0 | 1082807 | 982.81 % |
| 07-06-2013 | 106.4651 | 10000.0 | 1064651 | 964.65 % |
| 08-07-2013 | 105.4989 | 10000.0 | 1054989 | 954.99 % |
| 07-08-2013 | 102.1767 | 10000.0 | 1021767 | 921.77 % |
| 10-09-2013 | 109.5065 | 10000.0 | 1095065 | 995.06 % |
| 07-10-2013 | 109.9789 | 10000.0 | 1099789 | 999.79 % |
| 07-11-2013 | 114.0551 | 10000.0 | 1140551 | 1040.55 % |
| 09-12-2013 | 116.1772 | 10000.0 | 1161772 | 1061.77 % |
| 07-01-2014 | 114.5882 | 10000.0 | 1145882 | 1045.88 % |
| 07-02-2014 | 113.1986 | 10000.0 | 1131986 | 1031.99 % |
| 07-03-2014 | 120.0186 | 10000.0 | 1200186 | 1100.19 % |
| 07-04-2014 | 121.8646 | 10000.0 | 1218646 | 1118.65 % |
| 07-05-2014 | 120.7409 | 10000.0 | 1207409 | 1107.41 % |
| 09-06-2014 | 140.7876 | 10000.0 | 1407876 | 1307.88 % |
| 07-07-2014 | 144.3263 | 10000.0 | 1443263 | 1343.26 % |
| 07-08-2014 | 141.4327 | 10000.0 | 1414327 | 1314.33 % |
| 08-09-2014 | 152.011 | 10000.0 | 1520110 | 1420.11 % |
| 07-10-2014 | 147.2518 | 10000.0 | 1472518 | 1372.52 % |
| 07-11-2014 | 153.7811 | 10000.0 | 1537811 | 1437.81 % |
| 08-12-2014 | 159.3006 | 10000.0 | 1593006 | 1493.01 % |
| 07-01-2015 | 155.6394 | 10000.0 | 1556394 | 1456.39 % |
| 09-02-2015 | 163.3437 | 10000.0 | 1633437 | 1533.44 % |
| 09-03-2015 | 169.7809 | 10000.0 | 1697809 | 1597.81 % |
| 07-04-2015 | 168.6537 | 10000.0 | 1686537 | 1586.54 % |
| 07-05-2015 | 155.3194 | 10000.0 | 1553194 | 1453.19 % |
| 08-06-2015 | 157.8349 | 10000.0 | 1578349 | 1478.35 % |
| 07-07-2015 | 168.4017 | 10000.0 | 1684017 | 1584.02 % |
| 07-08-2015 | 172.2953 | 10000.0 | 1722953 | 1622.95 % |
| 07-09-2015 | 152.7514 | 10000.0 | 1527514 | 1427.51 % |
| 07-10-2015 | 163.1373 | 10000.0 | 1631373 | 1531.37 % |
| 09-11-2015 | 160.2461 | 10000.0 | 1602461 | 1502.46 % |
| 07-12-2015 | 158.0063 | 10000.0 | 1580063 | 1480.06 % |
| 07-01-2016 | 153.3481 | 10000.0 | 1533481 | 1433.48 % |
| 08-02-2016 | 149.2672 | 10000.0 | 1492672 | 1392.67 % |
| 08-03-2016 | 150.1291 | 10000.0 | 1501291 | 1401.29 % |
| 07-04-2016 | 153.2553 | 10000.0 | 1532553 | 1432.55 % |
| 09-05-2016 | 157.7953 | 10000.0 | 1577953 | 1477.95 % |
| 07-06-2016 | 164.9275 | 10000.0 | 1649275 | 1549.27 % |
| 07-07-2016 | 167.4591 | 10000.0 | 1674591 | 1574.59 % |
| 08-08-2016 | 176.8555 | 10000.0 | 1768555 | 1668.55 % |
| 07-09-2016 | 181.2292 | 10000.0 | 1812292 | 1712.29 % |
| 07-10-2016 | 179.0495 | 10000.0 | 1790495 | 1690.49 % |
| 07-11-2016 | 174.7378 | 10000.0 | 1747378 | 1647.38 % |
| 07-12-2016 | 164.9713 | 10000.0 | 1649713 | 1549.71 % |
| 09-01-2017 | 166.854 | 10000.0 | 1668540 | 1568.54 % |
| 07-02-2017 | 177.8565 | 10000.0 | 1778565 | 1678.57 % |
| 07-03-2017 | 179.1486 | 10000.0 | 1791486 | 1691.49 % |
| 07-04-2017 | 185.2188 | 10000.0 | 1852188 | 1752.19 % |
| 08-05-2017 | 190.8389 | 10000.0 | 1908389 | 1808.39 % |
| 07-06-2017 | 194.5349 | 10000.0 | 1945349 | 1845.35 % |
| 07-07-2017 | 196.4145 | 10000.0 | 1964145 | 1864.14 % |
| 07-08-2017 | 203.2739 | 10000.0 | 2032739 | 1932.74 % |
| 07-09-2017 | 202.4345 | 10000.0 | 2024345 | 1924.35 % |
| 09-10-2017 | 201.5085 | 10000.0 | 2015085 | 1915.08 % |
| 07-11-2017 | 208.9105 | 10000.0 | 2089105 | 1989.11 % |
| 07-12-2017 | 207.3868 | 10000.0 | 2073868 | 1973.87 % |
| 08-01-2018 | 216.2901 | 10000.0 | 2162901 | 2062.9 % |
| 07-02-2018 | 208.2612 | 10000.0 | 2082612 | 1982.61 % |
| 07-03-2018 | 200.1437 | 10000.0 | 2001437 | 1901.44 % |
| 09-04-2018 | 205.8277 | 10000.0 | 2058277 | 1958.28 % |
| 07-05-2018 | 208.9694 | 10000.0 | 2089694 | 1989.69 % |
| 07-06-2018 | 207.1053 | 10000.0 | 2071053 | 1971.05 % |
| 09-07-2018 | 207.067 | 10000.0 | 2070670 | 1970.67 % |
| 07-08-2018 | 216.8914 | 10000.0 | 2168914 | 2068.91 % |
| 07-09-2018 | 219.7872 | 10000.0 | 2197872 | 2097.87 % |
| 08-10-2018 | 193.2249 | 10000.0 | 1932249 | 1832.25 % |
| 09-11-2018 | 199.961 | 10000.0 | 1999610 | 1899.61 % |
| 07-12-2018 | 202.5288 | 10000.0 | 2025288 | 1925.29 % |
| 07-01-2019 | 204.6035 | 10000.0 | 2046035 | 1946.03 % |
| 07-02-2019 | 208.4337 | 10000.0 | 2084337 | 1984.34 % |
| 07-03-2019 | 208.9948 | 10000.0 | 2089948 | 1989.95 % |
| 08-04-2019 | 217.1231 | 10000.0 | 2171231 | 2071.23 % |
| 07-05-2019 | 215.9082 | 10000.0 | 2159082 | 2059.08 % |
| 07-06-2019 | 227.0958 | 10000.0 | 2270958 | 2170.96 % |
| 08-07-2019 | 224.9023 | 10000.0 | 2249023 | 2149.02 % |
| 07-08-2019 | 209.6366 | 10000.0 | 2096366 | 1996.37 % |
| 09-09-2019 | 211.0241 | 10000.0 | 2110241 | 2010.24 % |
| 07-10-2019 | 213.2105 | 10000.0 | 2132105 | 2032.11 % |
| 07-11-2019 | 229.5965 | 10000.0 | 2295965 | 2195.97 % |
| 09-12-2019 | 227.8031 | 10000.0 | 2278031 | 2178.03 % |
| 07-01-2020 | 227.4624 | 10000.0 | 2274624 | 2174.62 % |
| 07-02-2020 | 232.4414 | 10000.0 | 2324414 | 2224.41 % |
| 09-03-2020 | 203.2189 | 10000.0 | 2032189 | 1932.19 % |
| 07-04-2020 | 166.5874 | 10000.0 | 1665874 | 1565.87 % |
| 07-05-2020 | 173.1719 | 10000.0 | 1731719 | 1631.72 % |
| 08-06-2020 | 188.5741 | 10000.0 | 1885741 | 1785.74 % |
| 07-07-2020 | 198.4511 | 10000.0 | 1984511 | 1884.51 % |
| 07-08-2020 | 206.4298 | 10000.0 | 2064298 | 1964.3 % |
| 07-09-2020 | 206.5324 | 10000.0 | 2065324 | 1965.32 % |
| 07-10-2020 | 211.1932 | 10000.0 | 2111932 | 2011.93 % |
| 09-11-2020 | 225.7658 | 10000.0 | 2257658 | 2157.66 % |
| 07-12-2020 | 239.7371 | 10000.0 | 2397371 | 2297.37 % |
| 07-01-2021 | 256.2531 | 10000.0 | 2562531 | 2462.53 % |
| 08-02-2021 | 280.7386 | 10000.0 | 2807386 | 2707.39 % |
| 08-03-2021 | 280.2334 | 10000.0 | 2802334 | 2702.33 % |
| 07-04-2021 | 275.5394 | 10000.0 | 2755394 | 2655.39 % |
| 07-05-2021 | 279.0867 | 10000.0 | 2790867 | 2690.87 % |
| 07-06-2021 | 295.4274 | 10000.0 | 2954274 | 2854.27 % |
| 07-07-2021 | 302.21 | 10000.0 | 3022100 | 2922.1 % |
| 09-08-2021 | 311.9292 | 10000.0 | 3119292 | 3019.29 % |
| 07-09-2021 | 328.5305 | 10000.0 | 3285305 | 3185.3 % |
| 07-10-2021 | 335.4749 | 10000.0 | 3354749 | 3254.75 % |
| 08-11-2021 | 346.107 | 10000.0 | 3461070 | 3361.07 % |
| 07-12-2021 | 327.5746 | 10000.0 | 3275746 | 3175.75 % |
| 07-01-2022 | 339.4866 | 10000.0 | 3394866 | 3294.87 % |
| 07-02-2022 | 332.4215 | 10000.0 | 3324215 | 3224.22 % |
| 07-03-2022 | 301.2744 | 10000.0 | 3012744 | 2912.74 % |
| 07-04-2022 | 335.7585 | 10000.0 | 3357585 | 3257.59 % |
| 09-05-2022 | 309.1323 | 10000.0 | 3091323 | 2991.32 % |
| 07-06-2022 | 307.6471 | 10000.0 | 3076471 | 2976.47 % |
| 07-07-2022 | 305.9955 | 10000.0 | 3059955 | 2959.95 % |
| 08-08-2022 | 329.7267 | 10000.0 | 3297267 | 3197.27 % |
| 07-09-2022 | 333.8162 | 10000.0 | 3338162 | 3238.16 % |
| 07-10-2022 | 327.8351 | 10000.0 | 3278351 | 3178.35 % |
| 07-11-2022 | 343.3595 | 10000.0 | 3433595 | 3333.59 % |
| 07-12-2022 | 351.8401 | 10000.0 | 3518401 | 3418.4 % |
| 09-01-2023 | 344.0903 | 10000.0 | 3440903 | 3340.9 % |
| 07-02-2023 | 335.9913 | 10000.0 | 3359913 | 3259.91 % |
| 08-03-2023 | 336.5923 | 10000.0 | 3365923 | 3265.92 % |
| 10-04-2023 | 334.21 | 10000.0 | 3342100 | 3242.1 % |
| 08-05-2023 | 345.0899 | 10000.0 | 3450899 | 3350.9 % |
| 07-06-2023 | 358.7065 | 10000.0 | 3587065 | 3487.06 % |
| 07-07-2023 | 367.7075 | 10000.0 | 3677075 | 3577.07 % |
| 07-08-2023 | 377.5147 | 10000.0 | 3775147 | 3675.15 % |
| 07-09-2023 | 381.9033 | 10000.0 | 3819033 | 3719.03 % |
| 09-10-2023 | 375.9177 | 10000.0 | 3759177 | 3659.18 % |
| 07-11-2023 | 374.4858 | 10000.0 | 3744858 | 3644.86 % |
| 07-12-2023 | 410.7765 | 10000.0 | 4107765 | 4007.76 % |
| 08-01-2024 | 424.7515 | 10000.0 | 4247515 | 4147.52 % |
| 07-02-2024 | 434.9199 | 10000.0 | 4349199 | 4249.2 % |
| 07-03-2024 | 449.0133 | 10000.0 | 4490133 | 4390.13 % |
| 08-04-2024 | 457.188 | 10000.0 | 4571880 | 4471.88 % |
| 07-05-2024 | 452.7494 | 10000.0 | 4527494 | 4427.49 % |
| 07-06-2024 | 480.6962 | 10000.0 | 4806962 | 4706.96 % |
| 08-07-2024 | 500.6741 | 10000.0 | 5006741 | 4906.74 % |
| 07-08-2024 | 502.8591 | 10000.0 | 5028591 | 4928.59 % |
| 09-09-2024 | 509.6536 | 10000.0 | 5096536 | 4996.54 % |
| 07-10-2024 | 500.3813 | 10000.0 | 5003813 | 4903.81 % |
| 07-11-2024 | 493.2533 | 10000.0 | 4932533 | 4832.53 % |
| 09-12-2024 | 501.4629 | 10000.0 | 5014629 | 4914.63 % |
| 07-01-2025 | 480.3504 | 10000.0 | 4803504 | 4703.5 % |
| 07-02-2025 | 476.5109 | 10000.0 | 4765109 | 4665.11 % |
| 07-03-2025 | 453.0031 | 10000.0 | 4530031 | 4430.03 % |
| 07-04-2025 | 446.9999 | 10000.0 | 4469999 | 4370.0 % |
| 07-05-2025 | 485.0063 | 10000.0 | 4850063 | 4750.06 % |
| 09-06-2025 | 504.4657 | 10000.0 | 5044657 | 4944.66 % |
| 07-07-2025 | 507.4064 | 10000.0 | 5074064 | 4974.06 % |
| 07-08-2025 | 489.2871 | 10000.0 | 4892871 | 4792.87 % |
| 08-09-2025 | 497.8282 | 10000.0 | 4978282 | 4878.28 % |
| 07-10-2025 | 507.8016 | 10000.0 | 5078016 | 4978.02 % |
| 07-11-2025 | 514.1925 | 10000.0 | 5141925 | 5041.93 % |
| 08-12-2025 | 519.8496 | 10000.0 | 5198496 | 5098.5 % |
| 07-01-2026 | 528.7287 | 10000.0 | 5287287 | 5187.29 % |
| 03-02-2026 | 519.7643 | 10000.0 | 5197643 | 5097.64 % |
RETURNS CALCULATOR for Tata Large Cap Fund -Regular Plan - Growth Option
Growth of 10000 In SIP (Fund vs Benchmark)
Growth of 10000 In LUMPSUM (Fund vs Benchmark)
Rolling Returns
Rolling returns are the annualized returns of the scheme taken for a specified period (rolling returns period) on every day/week/month and taken till the last day of the duration. In this chart we are showing the annualized returns over the rolling returns period on every day from the start date and comparing it with the benchmark. Rolling returns is the best measure of a fund's performance. Trailing returns have a recency bias and point to point returns are specific to the period in consideration. Rolling returns, on the other hand, measures the fund's absolute and relative performance across all timescales, without bias.
Market Cap Distribution
Small Cap
7.78%
Others
3.29%
Large Cap
84.51%
Mid Cap
4.42%
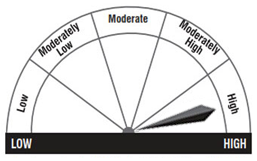
Riskometer
Key Performance and Risk Statistics of Tata Large Cap Fund -Regular Plan - Growth Option
| Key Statistics | Volatility | Sharpe Ratio | Alpha | Beta | Yield to Maturity | Average Maturity |
|---|---|---|---|---|---|---|
| Tata Large Cap Fund -Regular Plan - Growth Option | 12.66 | 0.79 | 0.61 | 0.97 | - | - |
| Equity: Large Cap | - | - | - | - | - | - |
PEER COMPARISION of Tata Large Cap Fund -Regular Plan - Growth Option
PORTFOLIO ANALYSIS of Tata Large Cap Fund -Regular Plan - Growth Option
Asset Allocation (%)
| Allocation | Percentage (%) |
|---|